Showing posts with label Anis Rahman. Show all posts

Monday, April 20, 2020

Spectroscopic terahertz imaging probes the inner structures of 0D-3D nanomaterials

Terahertz time-domain scanning technology provides camera-less, lattice-resolution, layer-by-layer imaging and identification of the internal structures of simple and complex nanomaterials.
FIGURE 1. For the terahertz nanoscanner setup, both reflection- and transmission-mode measurements are possible (a). The sample remains stationary while the nanoscanner scans the sample over a chosen area or volume. Here, an optical wafer is mounted on the terahertz nanoscanner to prepare for imaging (b).

ANIS RAHMAN

https://www.laserfocusworld.com/detectors-imaging/article/14167860/spectroscopic-terahertz-imaging-probes-the-inner-structures-of-0d3d-nanomaterials

As nanotechnology progresses, the photonics community is now tasked with measuring and identifying nanoscale materials with extremely small and varied structural parameters.
On the nanoscale, zero-dimensional (0D) structures are those that have truly nanoscale dimensions on the order of 10 nm in size or less, such as quantum dots.1 These 0D materials do not form a molecular network of multidimensionality, but remain as a nano-dimensional entity, with a size smaller than the de Broglie wavelength.
Nanomaterials such as nanowires or nanorods that form a molecular network and extend their length along one direction only while their diameter remains unchanged at <100 nm are termed one-dimensional (1D) nanomaterials. Alternatively, two-dimensional (2D) or planar nanomaterials like graphene and carbon nanotubes form a molecular network in both the x- and y-directions, with examples of 2D allotropes including borophene, germanene, silicene, phosphorene, and stanine. And finally, when aggregated in a size bigger than 100 nm, all materials fall in the realm of 3D, expanding their unit cells in all three orthogonal directions.
While modern nanophotonic processes have facilitated the synthesis and production of these exotic nanomaterials, measurement and proper characterization of these nanoscale and subnanoscale materials pose new challenges to available instrumentation.
The TNS3DI terahertz time-domain imager from ARP (Harrisburg, PA) can analyze and quantify the above-mentioned materials, from 0D to 3D. In earlier research, the measurement of surface properties such as surface topography, texture, step height, and more—over a wide range of surfaces and materials—has been demonstrated.2 But the metrology of 0D–3D materials involves not only quantifying their size parameter and size distribution, it also involves quantifying the interaction of one nanomaterial with another.

Zero-dimensional quantum dots

A quantum dots (QD) is a nanocrystal that confines electrons and holes within its de Broglie wavelength; as such, these nanocrystals are only a few nanometers in size. At this scale, the electron is confined in a small region of space and occupies discrete energy levels that are analogous to those of a single atom. For this reason, QDs are also referred to as “artificial atoms.”
Quantum dots are most commonly fabricated using epitaxial techniques such as molecular beam epitaxy (MBE) or by colloidal chemistry. Ordinarily, an atomic force microscope (AFM) is used to image the QDs; a scanning electron microscope (SEM) can also be used when the QDs are deposited on a substrate such as a glass slide.
Alternatively, the ARP TNS3DI camera-less imaging technique characterizes 0D to 3D nanomaterials using terahertz radiation. The terahertz setup consists of a nanoscanner that digitizes an object over a 3D space (see Fig. 1).
It is well known that the resolution of images formed by a focusing lens on a recording medium—photographic film or a charge-coupled device (CCD)—is determined by the Abbe diffraction limit (ADL) that sets the resolution to the highest value of half the wavelength of the light used for imaging. Fortunately, ADL can be overcome (and higher-resolution images obtained) through terahertz multispectral reconstructive imaging.3
Since most materials are transparent to terahertz radiation, the ARP nanoscanner can probe and visualize subsurface features in a nondestructive, noncontact fashion. Together, hardware and software enable user-defined pixel sizes (voxel sizes in 3D), while a digital camera displays and records the processed signal from a sample with a fixed pixel size.
In a camera, an object is focused on a CCD or a focal plane array and a built-in processor displays the image on a screen and saves the image data in a file. In contrast, the terahertz technique eliminates the CCD and lens system by using a nanoscanner and a suitable computer algorithm for image generation and processing, eliminating the focusing lens and the CCD.
Here, the object to be imaged is scanned (digitized) along the three orthogonal axes for 3D imaging or digitized on a plane for surface imaging. A matrix containing the digitized reflected signal (or, equivalently, the transmitted signal) is recorded in a file and then processed by a suitable algorithm. Experimental measurement of the lattice constant of metallic nickel at 0.353 nm is the same value accepted in the scientific literature, therefore validating the terahertz imaging technique.
FIGURE 2. The terahertz nanoscanner reveals a low-resolution image of quantum dots (QDs) spun on a silicon wafer (a); software translates the QDs into a 3D image or data cube (b)

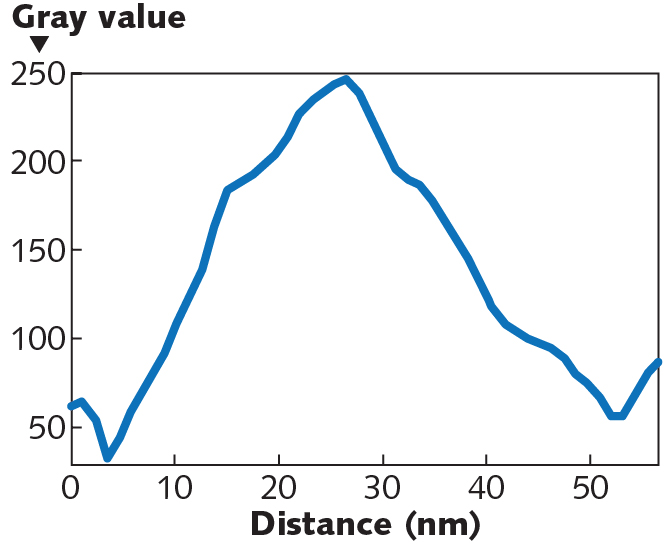
In the case of multiple 0D QDs spun on a silicon wafer, the nanoscanner imaging data shows the physical attributes of the QDs in the xy plane and is then translated into a 3D data cube that clearly delineates the individual dots (see Fig. 2). From the intensity matrix, a detailed image of the individual dots can be generated to obtain dimensional information (see Fig. 3).
FIGURE 3. Graphical analysis of a single QD in a field of QDs (a) shows a diameter of approximately 8 nm (b).

One-dimensional structure characterization

Nanowires and carbon nanotubes are examples of 1D nanomaterials. Since their length is much bigger compared to their width (diameter), they qualify as 1D structures. Carbon nanotubes (CNTs) are cylindrical nanostructures that can be classified as single-walled and multi-walled carbon nanotubes (SWCNTs and MWCNTs).
With unique properties that lend themselves to extraordinary applications in electronics and optics, terahertz analysis with the TNS3DI can measure numerous properties. With a built-in terahertz time-domain spectrometer, it can perform both spectral analysis and deep-level spectroscopy, whereby spectra are collected at different depths of a sample as specified by the user.
The TNS3DI implements a pump-probe technique with ARP’s proprietary terahertz source that works with a patented dendrimer dipole excitation (DDE) mechanism.4 Collecting the terahertz time-domain signal over a few picoseconds generates a signal known as an interferogram and the Fourier transform of that interferogram yields the absorption spectra of the sample (see Fig. 4). Prominent absorption peaks in the spectrum are observed at 1.72, 4.29, 6.61, 13.70, and 15.59 THz for the CNT samples. Here, data was collected between 0.1 and 30 THz—however, to increase legibility, the spectrum is only displayed up to 20 THz.
FIGURE 4. Fourier transforms of the time-domain data reveal the broadband terahertz absorbance spectra of MWCNTs.

Although CCD imaging devices such as digital microscopes and cameras normally have good resolution, higher levels of resolution are challenging and only surface details can be imaged. And while transmission electron microscopy (TEM) offers high resolution, it is strictly a destructive technique with laborious sample preparation, is only for small geometries, and does not offer 3D capability. Focused ion beam and x-ray diffractive (XRD) imaging are also destructive techniques.
FIGURE 5. A 3D image of a section of a MWCNT reveals the 3D organization of the annealed CNTs (a); a single CNT’s width is shown by the circle (b).
FIGURE 6. Size analysis from the MWCNT image reveals an average individual CNT diameter of 48.54 nm (edge to edge).

In contrast, TNS3DI-based terahertz imaging defines the pixel size (or, the voxel size in 3D) by a hardware and software combination, making it possible to characterize complex structures such as MWCNTs. For example, a representative 3D image of a section of MWCNTs shows various strands of the inner material from a 2 μm × 1 μm section, revealing a single CNT’s width (see Fig. 5). Size analysis shows the average diameter of the CNT to be about 48 nm (see Fig. 6). Further analysis shows the length at about 1200 nm or 1.2 µm—a value that compares favorably with TEM, electron-diffraction, and Raman studies.5

Two-dimensional graphene

In theory, graphene is supposed to be a single layer of carbon atoms—a 2D nanomaterial. Graphene is mostly extracted from graphite—an allotrope of the element carbon meaning it possesses the same atoms, but they are arranged differently, giving the material different properties. In reality, however, graphene is an exfoliate possessing several layers of carbon sheets.
At ARP, terahertz multispectral computed imaging provides direct measurement of the graphene layers (that is, the number of sheets of graphene) in an exfoliate. It also measures the thickness of a single layer in the exfoliate. High-quality graphene is expected to have less than 10 layers in an exfoliate and should have a layer (sheet) thickness of <1 nm. Graphene oxide’s (GO) number of sheets in an exfoliate is higher and so is the thickness of each sheet.
Once the 3D image of a given exfoliate is generated, several useful parameters may be extracted. In addition to the number of layers and their thicknesses, a fast-Fourier transform (FFT) diffraction pattern can also be generated to describe crystallographic information. This volumetric imaging data not only allows layer-by-layer thickness measurement, but can also be used to obtain an FFT diffraction pattern.

Three-dimensional nanomaterials

A recently published paper by Rahman et al. in Novel Research in Sciences (NRS) investigated the dilation of nickel lattice from samples of alumina rods containing layers of metals and insulators that were subjected to what is known as a low-energy nuclear reaction (LENR) experiment.6 The samples were obtained from Brillouin Energy Corporation (Berkeley, CA), which demonstrated that the samples produced excess output energy compared to the input, under their experimental conditions.
However, Rahman et al. found a different explanation of this higher output energy than what was thought to be LENR process. The authors postulated that the higher-energy-generation effect observed in the experiment was most likely a “lattice-driven phenomenon” as opposed to the nuclear transmutation of LENR.
Rahman et al. conducted an in situ and ex situ systematic investigation that assumes a “time-crystal-like non-equilibrium” process is driving the energy balance. Time crystals—a newer concept—are states of matter whose patterns repeat at set intervals of time and space. They are systems in which time symmetry is spontaneously broken. A time crystal never reaches thermal equilibrium, as it is a type of nonequilibrium matter proposed in 2012.
FIGURE 7. In high-resolution 3D images of four samples (1 µm3), the nickel-rich area of the materials shows embedded nanograins of alumina that cause lattice deformations

Using the terahertz time-domain technique, the authors analyzed a heated sample of crystalline nickel, which is more fluid-like than rigid near the glass-transition point (see Fig. 7). The applied thermal energy in a radio-frequency field sets the fluid-like nickel lattice into oscillation, producing a nonradiative transition that creates the increased heat energy. Instead of using an electron microscope, the terahertz technique breaks ground by using a larger terahertz wave that breaks the Abbe diffraction limit for lattice imaging. The experiment proves that the LENR is actually nonexistent and rather, a time-crystal-like non-equilibrium effect is driving the energy balance for what was considered to be a LENR phenomenon.
The ARP terahertz nanoscanner brings a new dawn of CCD-less imaging as nanomaterial characterization techniques have progressed from photographic film to CCD and finally to nanoscanner-based technologies. It is hoped this new technique will aid in solving a number of problems in industry and academia alike.
REFERENCES
1. A. Rahman et al., J. Biosens. Bioelectron., 7, 3, 1–8 (2016); doi:10.4172/2155-6210.1000221.
2. A. Rahman, “Application of TNS3DI as a Surface Metrology Tool,” doi:10.13140/rg.2.2.30786.73921 (2020).
3. A. Rahman and A. K. Rahman, IEEE Trans. Semicond. Manuf., 32, 1, 7–13 (Feb. 2019); doi:10.110 9/TSM.2018.2865167.
4. A. Rahman, A. K. Rahman, and D. A. Tomalia, Nanoscale Horiz., 2, 127–134 (Mar. 20, 2017); doi:10.1039/c7nh00010c.
5. W. Ghann et al., J. Nanomed. Nanotechnol., 10, 4, 535 (2019); doi:10.35248/2157-7439.19.10.535.
6. A. Rahman et al., Nov. Res. Sci. 2, 4, NRS.000545.2019 (2019); doi:10.31031/nrs.2019.2.000545.
Anis Rahman is president and chief technology officer at Applied Research & Photonics (ARP), Harrisburg, PA; e-mail: a.rahman@arphotonic.nethttp://arphotonics.net.

Saturday, March 17, 2018

US Patent-Thickness determination and layer characterization using terahertz scanning reflectometry


United States Patent 9909986
Inventors:
Rahman, Anis (Hummelstown, PA, US) 
Rahman, Aunik K. (Hummelstown, PA, US) 

http://www.freepatentsonline.com/9909986.html


A terahertz scanning reflectometer system is described herein for in-situ measurement of polymer coating thickness, semiconductor wafer's surface sub-surface inspection in a non-destructive and non-invasive fashion with very high resolution (e.g., 25 nm or lower) and spectral profiling and imaging of surface and sub-surface of biological tissues (e.g., skin) in a non-invasive fashion

Tuesday, March 21, 2017

Abstract-Engineering dendrimers to produce dendrimer dipole excitation based terahertz radiation sources suitable for spectrometry, molecular and biomedical imaging


Anis Rahman, A. K. Rahmana,  Donald A. Tomalia,

http://pubs.rsc.org/en/Content/ArticleLanding/2017/NH/C7NH00010C

Two critical nanoscale design parameters (CNDPs); namely, surface chemistry and interior compositions of poly(amidoamine) (PAMAM) dendrimers were systematically engineered to produce unique hyperpolarizable, electro-optical substrates. These electro-optically active dendritic films were demonstrated to produce high quality, continuous wave terahertz radiation when exposed to a suitable pump laser that could be used for spectrometry and molecular imaging. These dendrimer based dipole excitation (DDE) terahertz sources were used to construct a working spectrometer suitable for many practical applications including THz imaging and analysis of encapsulated hydrogen species in fullerenes.


Thursday, January 12, 2017

Terahertz spectroscopy and imaging of 3D semiconductors breaks the nanometer barrier


IMAGE: Researchers at ARP have broken the nanometer barrier for spectral and image analysis of 3D semiconductor structures by identifying sub-nanometer-sized nanoparticles or defects. (Image credit: ARP)


http://www.laserfocusworld.com/articles/2017/01/terahertz-spectroscopy-and-imaging-of-3d-semiconductors-breaks-the-nanometer-barrier.html
Researchers at Applied Research & Photonics (ARP; Harrisburg, PA) have broken the nanometer barrier for analysis of semiconductor layers in a 3D volume.1 The following is an excerpt with modifications from the paper describing the work performed:
For many integrated circuit and high speed transistor applications the strain in the epitaxial layers of a semiconductor is relieved by introducing misfit dislocations that has inherent strain in their lattice structure. Therefore, controlling the growth conditions and a strategic design of the structure is necessary for minimizing the density of dislocations threading through device layers grown on top of the relaxed buffer layer. While visualization of these structures on a nanometer scale is important, the time-domain spectroscopic investigation yields additional information about the molecular nature of these structures that are also important.

Especially, terahertz spectroscopic inspection on a layer-by-layer basis plays a key role for the success in creating controlled 3D semiconductor structures. The need to prevent strain relaxation in thin layers or to control the density and distribution of defects in relaxed structures has led to extensive research on strain relaxation mechanisms and also on the properties of the defects which are required to relieve the strain. Therefore, in addition to the spectroscopic analysis, 3D visualization of these structures on a nanometer scale is of paramount importance.
In particular, the capability of sub-surface inspection on a layer-by- layer basis in a non-destructive and non-contact mode is the key for success in creating such 3D structures.
In what follows, ARP describes terahertz time-domain spectroscopy and high resolution reconstructive imaging via terahertz reflectometry for strain relaxed SiGe/Ge/Si structures. Two cases are investigated. Grown Ge layer on Si <001> substrate is inspected by terahertz pump-probe signals as a function of thickness yielding layer-by-layer spectroscopic information of the epitaxial structures. Then, another sample is inspected where SiGe layer was grown on top of the Ge buffer of the first case, also via layer-by-layer terahertz pump-probe technique. The spectra are analyzed for their identifying features of the epitaxially grown semiconductor layers.
In addition, both samples were inspected by 3D sub-surface imaging. A side by side comparison is attempted. Clear visualization of the lattice stacking fault and defects was demonstrated that could shed light for streamlining the process parameters. We utilized terahertz non-contact multispectral reconstructive imaging to investigate aforementioned grown semiconductor layers.
An algorithm of gridding with inverse distance to power equations has been used for reconstructive imaging. The images are further analyzed via graphical means to measure the interface features and layer thicknesses. Nanoparticles with sub-nanometer dimensions were found within the semiconductor layers, breaking the nanometer boundary for this imaging analysis.
REFERENCE:
1. A. and AK Rahman, Journal of Biosensors and Bioelectronics 7, 4, 1000229 (2016); DOI: 10.4172/2155-6210.1000229.
SOURCE: Applied Research & Photonics; http://npic.us

Tuesday, October 11, 2016

Abstract-Terahertz Sub-Nanometer Sub-Surface Imaging of 2D Materials


Rahman A1*, Rahman AK1, Yamamoto T2 and Kitagawa H2
1Applied Research and Photonics, Friendship Road, Harrisburg, United States
2Graduate School of Science, Kyoto University, Kyoto-fu, Japan
*Corresponding Author:
Anis Rahman
Applied Research and Photonics, 470 Friendship Road, Suite 10
Harrisburg, PA 17111, United States
Tel: +1-717-623-8201
E-mail: a.rahman@arphotonics.net
http://www.omicsonline.org/open-access/terahertz-subnanometer-subsurface-imaging-of-2d-materials-2155-6210-1000221.php?aid=80210

Terahertz sub-surface imaging offers an effective solution for surface and 3D imaging because of minimal sample preparation requirements and its ability to “see” below the surface. Another important property is the ability to inspect on a layer-by layer basis via a non-contact route, non-destructive route. Terahertz 3D imager designed at Applied Research and Photonics (Harrisburg, PA) has been used to demonstrate reconstructive imaging with a resolution of less than a nanometer. Gridding with inverse distance to power equations has been described for 3D image formation. A continuous wave terahertz source derived from dendrimer dipole excitation has been used for reflection mode scanning in the three orthogonal directions. Both 2D and 3D images are generated for the analysis of silver iodide quantum dots’ size parameter. Layer by layer image analysis has been outlined. Graphical analysis was used for particle size and layer thickness determinations. The demonstrated results of quantum dot particle size checks well with those determined by TEM micrograph and powder X-ray diffraction analysis. The reported non-contact measurement system is expected to be useful for characterizing 2D and 3D naomaterials as well as for process development and/or quality inspection at the production line.


Sunday, July 31, 2016

Abstract-Terahertz 3D Imaging of Nanomaterial Interfaces for Sub-nanometer Analysis


Anis Rahman and Aunik Rahman

Sub-nanometer imaging with size measurement was achieved via terahertz route. We describe a new technique of 3D imaging with layer-by-layer inspection capability in a non-contact fashion with resolution less than a nanometer. A high power, CW terahertz energy is utilized for scanning a specimen.
© 2016 OSA
PDF Article

Monday, February 29, 2016

Abstract-Dendrimer Dipole Excitation: A New Mechanism for Terahertz Generation


Anis Rahman A1*, Aunik Rahman1 and Donald A Tomalia2
1Applied Research and Photonics, 470 Friendship Road, Suite 10, Harrisburg, PA 17111, USA
2Nano Synthons LLC, 1200 N, Fancher Avenue, Mt. Pleasant, MI 48858, USA

http://www.omicsonline.org/open-access/dendrimer-dipole-excitation-a-new-mechanism-for-terahertz-generation-2155-6210-1000196.php?aid=68714

An electro-optic dendrimer (EO dendrimer) material has been designed for high power terahertz generation. An ordinary poly (amidoamine organosilicon) (PAMAMOS) dendrimer was modified via doping and poling to generate a high electro-optic coefficient nanomaterial. Measured EO coefficient varied from ~130 pm/V at 633 nm to ~90 pm/V at 1553 nm. An emitter designed from this EO dendrimer generates milliwatts of continuous wave (CW) terahertz radiation (T-ray) when pumped by a CW laser of suitable wavelength. The mechanism termed as the dendrimer dipole excitation (DDE) works via excitation of the dipole population generated by the doping process. The doping protocol also generates a distribution of dipole moments, as opposed to fixed dipoles in the lattice of a crystalline material; thus, when excited by a suitable pump laser, these dipoles radiate a broadband frequency that range from 0.1 THz to ~ 30 THz. A terahertz time-domain spectrometer (TeraSpectra) was designed with this DDE terahertz source. As a test of the spectrometer functionality, a standard polyethylene calibration was conducted. It was found that TeraSpectra reproduces several known absorbance peaks of polyethylene. It also produces additional absorbance peaks not observed before. It is surmised that the ultra-high sensitivity of T-ray enables observation and discovery of additional absorbance peaks that are not visible via other spectroscopy such as visible, UV, FTIR or Raman.

Wednesday, January 20, 2016

Abstract-Terahertz scanning reflectometer


United States Patent 9239290
Inventors:

Rahman, Anis (Hummelstown, PA, US
Rahman, Aunik K. (Hummelstown, PA, US
http://www.freepatentsonline.com/9239290.html

A terahertz scanning reflectometer is described herein. A high sensitivity terahertz scanning reflectometer is used to measure dynamic surface deformation and delamination characteristics in real-time. A number of crucial parameters can be extracted from the reflectance measurements such as dynamic deformation, propagation velocity, and final relaxation position. A terahertz reflectometer and spectrometer are used to determine the permeation kinetics and concentration profile of active ingredients in stratum corneum.

Wednesday, September 3, 2014

Terahertz reflectometry identifies early skin cancer


Applied Research & Photonics (ARP; Harrisburg, PA) is applying its terahertz-reflectometry systems—which have also been used for multilayer paint-thickness analysis and fault detection in silicon chips—to the identification of early-stage skin cancer. In the experimental setup, both benign and basal cell carcinoma (BCC) skin samples are analyzed using terahertz reflectometry, terahertz time-domain spectroscopy, and terahertz imaging. The electro-optic dendrimer (EOD)-based continuous-wave (CW) terahertz source—which emits broadband energy from 1 THz to approximately 35 THz—exploits a mechanism invented by ARP called dendrimer dipole excitation (DDE). This mechanism stems from the fact that the EOD has a high electro-optic coefficient (around 130 pm/V) and thus offers high conversion efficiency.
The terahertz source is reflected off the highly layered structure of human skin and the layering information is obtained by subtracting the reflected intensity data from the baseline (empty cell) data. Data analysis reveals that healthy skin is evenly layered while the layering pattern of cancerous cells is significantly diminished, indicating cell agglomeration and/or tumor formation. Measurements with an ARP TeraSpectra spectrometer confirm that healthy skin produces a terahertz spectrum that is different than diseased skin. A reconstructive-imaging algorithm is used to create 3D skin images that confirm healthy skin exhibits a regular cellular pattern while the cancerous tissue is amorphous. The noninvasive technique could eliminate the need for biopsy as the main mode of skin-cancer diagnosis. Contact Anis Rahman ata.rahman@arphotonics.net.

Tuesday, May 20, 2014

Terahertz reflectometry technique ensures perfect auto paint job


This three-dimensional image of a small patch of a painted surface shows that the paint is non-uniform, consisting of four different layers. Credit: Applied Research & Photonics.
Lyndsay Meyer
http://phys.org/news/2014-05-terahertz-reflectometry-technique-auto-job.html#jCp

(Phys.org) —To keep your new car looking sleek and shiny for years, factories need to make certain that the coats of paint on it are applied properly. But ensuring that every coat of paint—whether it is on a car or anything else—is of uniform thickness and quality is not easy.

Now researchers have developed a new way to measure the thickness of paint layers and the size of particles embedded inside. Unlike conventional methods, the paint remains undamaged, making the technique useful for a variety of applications from cars to artifacts, cancer detection and more. The researchers will describe their work at CLEO: 2014 being held June 8-13 in San Jose, California, USA.
"It's a problem that's quite challenging," said Anis Rahman, founder of Applied Research and Photonics, Inc., in Harrisburg, Pennsylvania. "None of the current methods are very successful in determining the thickness of individual layers and coatings in a nondestructive fashion."
The new technique, which was developed by Rahman and his son, Aunik, uses terahertz reflectometry, in which a beam of terahertz-frequency radiation is fired onto the paint. Terahertz radiation, which has frequencies between infrared and microwave radiation, is nonionizing and therefore harmless, Rahman said.
The terahertz beam penetrates the paint layers, which are each tens of microns (millionths of a meter) thick and bounces back at different intensities of light depending on the thickness of each layer of material the beam encounters. Measuring the intensities of the reflected beams reveals the thickness of each coat of paint down to a precision of tens of nanometers, almost a million times narrower than the head of a pin. This method can also be used to estimate the size of any particles added to the paint as small as 25 nanometers.
In addition to quality control, the method would be useful for testing paints as well, Rahman said. For example, in order for an overcoat on a car to protect the paint underneath, the two layers have to remain separate. Terahertz reflectometry can be used to make sure that the overcoat does not penetrate the layers below. The method can also help companies analyze how their paints react with different surfaces, such as plastic, wood or metal.

Busting rust with light: New technique safely penetrates top coat for perfect paint job
Terahertz reflectometry reveals the paint surface's texture, which is produced by mica flakes added to the paint. Credit: Applied Research & Photonics.

Environmental health applications are also possible, Rahman said, since the method can help detect whether old paint contains lead. Archaeologists and art historians can even employ it to analyze the paint on artifacts.
But terahertz reflectometry is useful for more than analyzing , Rahman added. The researchers are now configuring their techniques to analyze the structure of skin as a way to help diagnose early stages of skin cancer such as melanoma and basal cell carcinoma. With the addition of spectroscopy to measure the different wavelengths of reflected beams, this technique can be used to analyze the structure of skin layers and determine if they are healthy or diseased.
The instrument is ready for commercialization and Rahman says they are currently looking for partners to help bring it to market.


More information: Presentation AW3H.4, titled "Terahertz reflectometry of multi-layered paint thicknesses and estimation of particle sizes," will take place Wednesday, June 11, at 5:15 p.m. in Executive Ballroom 210H of the San Jose Convention Center.


Wednesday, November 27, 2013

T-rays offer potential for earlier diagnosis of melanoma


http://www.thealmagest.com/t-rays-offer-potential-earlier-diagnosis-melanoma/4343
The technology that peeks underneath clothing at airport security screening check points has great potential for looking underneath human skin to diagnose cancer at its earliest and most treatable stages, a scientist said here today.
The report on efforts to use terahertz radiation — “T-rays” — in early diagnosis of skin cancer was part of the 246th National Meeting & Exposition of the American Chemical Society, the world’s largest scientific society. Almost 7,000 reports on new advances in science and other topics are on the schedule for the meeting. It continues here through Thursday in the Indiana Convention Center and downtown hotels.
Anis Rahman, Ph.D., who spoke on the topic, explained that malignant melanoma, the most serious form of skin cancer, starts in pigment-producing cells located in the deepest part of the epidermis. That’s the outer layer of the skin. Biochemical changes that are hallmarks of cancer occur in the melanocytes long before mole-like melanomas appear on the skin.
“Terahertz radiation is ideal for looking beneath the skin and detecting early signs of melanoma,” Rahman said. “T-rays are different from X-rays, which are ‘ionizing’ radiation that can cause damage. T-rays are a form of ‘non-ionizing’ radiation, like ordinary visible light, but they can be focused harmlessly below into the body and capture biochemical signatures of events like the start of cancer.”
T-rays occupy a niche in the spectrum of electromagnetic radiation, which includes X-rays and visible light, between microwaves like those used in kitchen ovens and the infrared rays used in TV remote controls. One of the advantages of T-rays is that they penetrate only a few millimeters through cloth, skin and other non-metallic material. Ten sheets of printer paper would be about 1 millimeter thick. This key characteristic has led to their use in quality control in the pharmaceutical industry to check the surface integrity of pills and capsules, in homeland security to remotely frisk underneath clothes, and as a non-destructive way of probing beneath the top layers of famous paintings and other culturally significant artwork.
Rahman, president and chief technology officer of Applied Research & Photonics in Harrisburg, Pa., said that medical imaging is one of their newest and most promising potential uses. He described research focusing T-rays through donated samples of human skin that suggest the technology could be valuable in diagnosing melanoma.
In addition to developing T-rays for cancer diagnostics, Rahman’s team has successfully harnessed them to measure the real-time absorption rates and penetration in the outer layer of skin of topically applied drugs and shampoo — measurements that until now had not been possible.
Other wide-ranging applications include the detection of early stages of tooth decay, trace pesticides on produce, flaws in pharmaceutical tablet coatings, and concealed weapons under clothing, as well as testing the effectiveness of skin cosmetics. Rahman’s talk was part of a symposium entitled “Terahertz Spectroscopy: Problem Solving for the 21st Century,” being held at the ACS meeting. Abstracts of those talks appear below.

###
The American Chemical Society is a nonprofit organization chartered by the U.S. Congress. With more than 163,000 members, ACS is the world’s largest scientific society and a global leader in providing access to chemistry-related research through its multiple databases, peer-reviewed journals and scientific conferences. Its main offices are in Washington, D.C., and Columbus, Ohio.
To automatically receive news releases from the American Chemical Society, contact newsroom@acs.org.
This research was presented at a meeting of the American Chemical Society.
Follow us: Twitter | Facebook
Abstracts
Terahertz subsurface imaging for biomedical applications
Anis Rahman, a.rahman@arphotonics.net, Aunik K Rahman. Terahertz, Applied Research & Photonics, Harrisburg, Pennsylvania 17111, United States
Terahertz radiation can be selectively focused on an interior layer of a substrate. This gives an advantage to inspect interior features in a non-invasive way. Terahertz being non-ionizing, is also safe for in-vivo use. Thus a high resolution imaging capability may find direct application in diagnostics for melanoma and other disorder under the skin. It can be further developed for early detection of breast cancer, for example. Other applications include defects detection of semiconductor wafers to minimize rejection problem. Fig. 1 & Fig. 2 show a volume tomogram of a wafer and surface tomogram of a substrate. Defects may be identified and quantified by comparing images of contaminated areas with that of good areas. This talk will outline the principle of this new line of measurement capabilities with practical examples.
Non-interaction of waves in applied spectrometry
Chandrasekhar Roychoudhuri1, chandra@phys.uconn.edu, Anis Rahman2. (1) Photonics Lab. U-5192, Univ. of Connecticut, 54 Ahern Lane, Storrs, CT 06269-5192, United States, (2) Terahertz, Applied Research & Photonics, Harrisburg, Pennsylvania 17111, United States
Theories of physics are constructed by using human invented mathematical logics while enforcing quantitative equality between the cause and the effect, mediated by some real physical processes; which are our interpretations. These interpretations are not 100% congruent with the ontological cosmic logics. So we must keep on improving theories by iterating. The cause is defined by ourhypothesis logics; the effect is defined through reproducible measurements and the physical processes are constructed by our imaginations, since the micro universe is still invisible to our technologies. How are these connected to chemistry, biology and evolution? Sustained evolution relies upon invention of tools and technologies, needed for gathering food and other comforts. Technology inventions are nothing but emulation of nature allowed physical processes in novel ways, or in novel combinations. Unfortunately, modern physics teaches us to stop enquiring, “Do electrons really follow orbits, or such processes?” This paper attempts to bring back causality in physics, by developing a causal theory of spectrometry to obtain super resolution, orders of magnitude better than δν/δt≥1. We follow the propagation process of the carrier frequency contained in a time-finite pulse through a spectrometer, instead of the non-causal Fourier monochromatic modes that exists for all time, requiring infinite amount of energy. Then we follow the physical processes behind the emergence of superposition effect registered as some physical transformation in a detector due to simultaneous stimulations induced on it by multiple EM waves generated by the interferometer (or the spectrometer). One then discovers, subtly hidden in Maxwell’s wave equation, the NIW-property (Non-Interaction of Waves). Like Occam’s razor, the NIW-property eliminates a number of unnecessary non-causal hypotheses of Quantum Mechanics, while explicitly recognizes the detector’s intrinsic time-averaging and detection circuit’s time-integration properties. These are essential for proper interpretation of spectral data in all spectrometry, including the field of Terahertz.
Terahertz spectroscopy of crystalline pharmaceuticals: Experiment and theory
Timothy M Korter, tmkorter@syr.edu, Department of Chemistry, Syracuse University, Syracsue, NY 13244-4100, United States
The terahertz (THz) or far-infrared region of the electromagnetic spectrum spans frequencies from 0.1 to 10 THz (1 THz ∼ 33.33 cm-1). The majority of crystalline solids exhibit characteristic lattice vibrations toward the lower limit (≤100 cm-1) of this range, making THz spectroscopy a powerful analytical tool for probing the intermolecular interactions within molecular crystals. Specific applications of THz spectroscopy relevant to the pharmaceutical industry will be discussed in this seminar, including studies regarding the detection of drug polymorphs, elucidation of difficult crystal structures, and the analysis of amorphous/crystalline mixtures. Despite recent experimental advances in the field, understanding the THz spectra of crystalline solids remains challenging, and identifying the complex vibrational motions giving rise to absorptions in this region is not trivial. Computational methods utilizing solid-state density functional theory augmented with corrections for weak London dispersion forces will be presented, revealing the origins of these low-frequency vibrational motions, and providing much needed physical insights into the experimental observations.
Terahertz responses of supramolecular assemblies: Applications to nanomedicine
Ross A Quick1, raquick@indiana.edu, Elliot R Brown2, Weidong Zhang2, Leamon Viveros2, Peter Ortoleva1. (1) Department of Chemistry, Indiana University, Bloomington, IN 47405, United States, (2) Department of Electrical Engineering, Wright State University, Dayton, OH 45435, United States
Autonomous and electrically driven THz structural fluctuations of virus-like and other supramolecular assemblies are analyzed using a computational approach. Both structure-wide and local oscillatory responses are discussed. The computational method is based on traditional molecular dynamics (MD) and on multiscale MD, both of which preserve all-atom detail and avoid calibration with experimental data through the use of an interatomic force field. The cross-talk among processes from the atomic to the ten nanometer scales are accounted for in the simulations. Applications in nanomedicine and materials are discussed, as are spectroscopic signatures. The virus-like particle consisting of L1 capsid proteins of human papillomavirus is a major demonstration system. Results for proteins and supramolecular assemblies of enterovirus, poliovirus, and hepatitis B virus are also presented, as is the application of this technology to the prediction of the viability of a given VLP as an antiviral vaccine.
Terahertz spectroscopic characterization of protein vaccine antigens and saponin-derived adjuvant macromolecules
Anis Rahman1, a.rahman@arphotonics.net, Aunik K Rahman1, Dale Ruby2, Trevor Broadt2. (1) Terahertz, Applied Research & Photonics, Harrisburg, Pennsylvania 17111, United States, (2) Process Analytics, Biopharmaceutical Development Program, SAIC-Frederick, Frederick, P.O. Box B, MD 21701, United States
Biopharmaceutical compounds such as recombinant viral protein antigens and saponin adjuvants are candidates for vaccination and treatment of virally induced cancers. These samples were analyzed by terahertz time domain spectroscopy on a standard polyethylene background. Aliquot 100 µL solution of each was dispensed on the PE card, allowed to dry overnight at room temperature. Dry sample weight was determined by a microbalance. The terahertz spectrometer was calibrated with respect to a blank polyethylene card. The biopharmaceutical samples spectra were then acquired one at a time (Fig. 1). It was found that the compounds under study exhibit rich spectral features over the range of 0.1THz to ~34THz (Fig. 2). Some of these peaks have been attempted to explain in terms of their molecular structure and chemical properties. These results will be discussed with exemplary spectra.
https://www.acs.org